Self-management interventions consist of several, possible interacting components. Dimitris Mavridis shares his experience of the statistical challenges in assessing the effectiveness of self-management interventions.
There are plenty of trials evaluating the effectiveness of self-management interventions (SMIs). A systematic review can summarise the current evidence. SMIs are complex, comprising several, possibly interacting, components. The main questions are: Do SMIs work in general? If so, which interventions? And which characteristics of these interventions? Network meta-analyses (NMA) help to answer such questions.
NMA is an increasingly popular method for synthesizing results from studies including more than two interventions. It allows us to estimate the relative effectiveness between interventions even if those have never been compared directly.
In the COMPAR-EU project we have identified hundreds of trials that evaluate SMIs. Such extensive evidence would make any statistician burst with excitement! I was quickly brought up to reality when I realized the nature of SMIs. These interventions are said to be complex, and for good reason! Our COMPAR-EU taxonomy identifies eight distinct categories associated with SMIs and 43 characteristics assigned to them. The categories are: support techniques, type of encounter, mode, time of communication, recipient, type of provider, location and intensity. There is a total of 72,576 different combinations of characteristics! We end up with more effects to be estimated than the data points used, and each trial compares a unique SMI. Hence, some theory-driven grouping of characteristics is necessary.
Disentangling the effect of each component
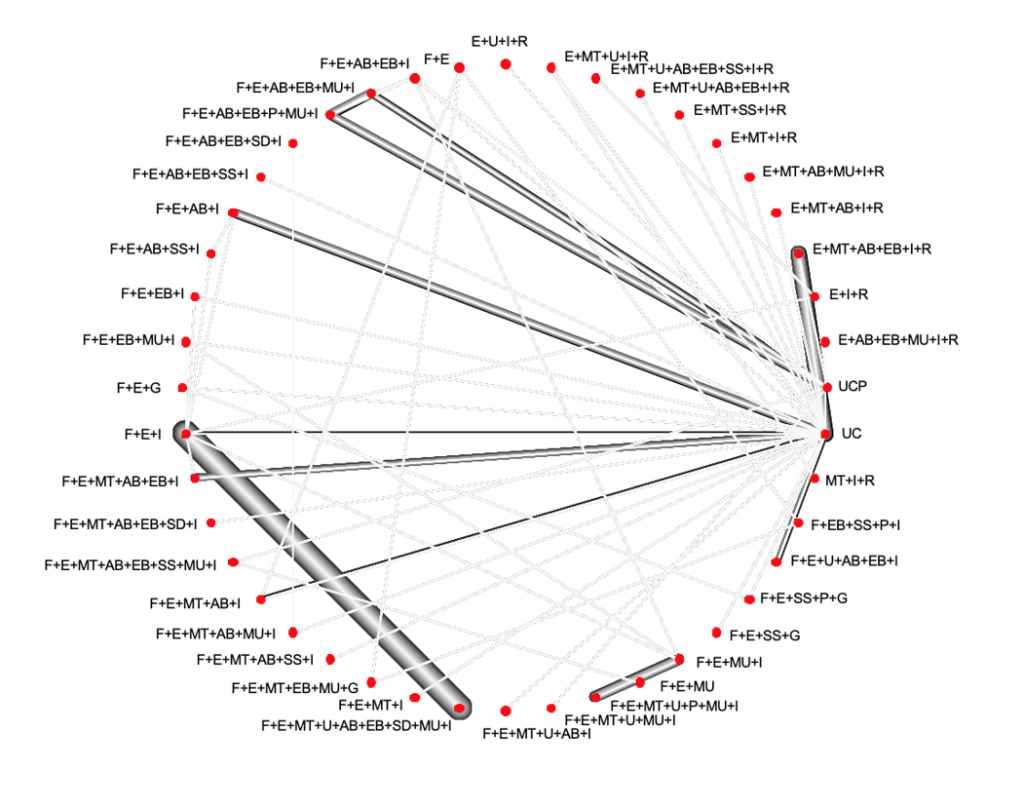
Statistics is all about uncertainty and assumptions. Variation of SMIs across trials give us information on both the components that work, and those did not. One should also think of the interactions among these characteristics e.g. a SMI may work if it includes coaching and social support (support techniques), given face-to-face (mode) by a physician (provider) but may not work if provided by a lay-person or remotely. Hence, on one hand, variation of SMIs is informative but on the other hand, with all these components, it is not straightforward how to disentangle the effect of each component and explore interactions. In COMPAR-EU, we focus on four chronic diseases (diabetes, obesity, heart failure and COPD). In the case of diabetes, there are 508 studies evaluating 209 distinct interventions for glycated haemoglobin and this happened after having grouped characteristics, from 43 down to 15! The network plot, consisting of nodes (interventions) and edges (direct evidence from studies) is chaotic! This is why we present here the network plot for an outcome (adherence) with far less studies (56).
 This network plot shows which interventions are compared. Nodes represent SMIs and the edges between the nodes represent comparisons that have been evaluated in the included RCTs. The thickness of the edges is proportional to the number of participants randomized to the respective comparison.

Dr Dimitris Mavridis
Dimitris has been involved in evidence synthesis for a decade now. He acts as a reviewer both for the Cochrane and the Campbell collaborations. He also serves as an associate editor for ‘Research Synthesis Methods’ and the series ‘statistics in practice’ in the ‘Evidence Based Mental Health’ journal. He has published many NMA and has been working mainly on statistical methodology surrounding NMA.
The definition of `usual care´ is crucial
So, what are we assuming when employing NMA? Consider we have studies comparing A and B, and studies comparing A and C. These two types of studies can inform the relative effectiveness between B and C, indirectly through A. That implies that A vs. B and A vs. C studies should be similar in terms of the distribution of each characteristic that may affect the effectiveness of the SMIs. This needs to be extended to the whole network plot. If not, there is a risk of confounding. It also means that interventions should be similarly defined across different studies. The control group is typically what is called ‘usual care’. That reflects the standard self-management of a patient with as little as possible involvement of the researcher. There is large variation in the definition of usual care across studies and this has implications not only for the interpretation of results but also for the NMA assumptions. Is the usual care the same when it includes just sharing information and when it includes other support techniques such as provision of equipment or skills training? Different “usual cares” may confound results and its definition is crucial since, as seen in the network plot, most SMIs are compared to usual care. There are further assumptions about estimating the effect of each component. The simplest, additive model assumes that the effect of a combination of components equals the sum of the individual effects. For example, the effect of a SMI that includes education, given face-to-face at an individual level (E+F+I) equals the sum of the effects of education (E), face-to-face (F) and individual (I). In practice, it could be the case, as Aristotle said, that ‘The whole is greater than the sum of its parts”. Two components may not work individually but when they are put together, they might work or have an effect larger than the sum of individual effects. It could also be the opposite, they may work antagonistically.
Generally, there are many challenges when evaluating component effects. Although relevant methodology is rapidly increasing, it is far from being considered established. With such complexity we need to separate noise from true information and this is not straightforward. The statistical literature has not succeeded in answering all the important questions regarding complex interventions and the answers we have found have raised further questions, but I would say, we are puzzled now at a higher level and about more important things.


